by Ben Kapsner
2/22/2017
Nothing beats the sound of plastic on plastic am I right? Part two of the MNWA’s “Player Rankings” series will shift focus from the defense to the offensive side of the game. Offense, may not dominate the MNWA today, but it is certainly the most entertaining part of the sport to watch.
As a brief reminder the total wiffleball rankings have been broken down into four criteria:
I graded all MNWA players on a variety of stats. Some are obvious (Batting Avg, OBP, Slugging Percentage). Others are commonly excepted in the sabermetric community (OPS, K%, BB%, K:BB ratio, BABIP). Finally, some are stats that I have developed specifically for wiffleball evaluation. Before the 2017 season, I developed a “baserunning efficiency” statistic. The idea is “how efficient are you at running the bases?”, and I gained impactful insights that were applied to the Buxtons this past season (effectively I might add). This stat will be heavily weighted in our “baserunning” score.
Just Missed:
Ben Kapsner: From 2013-2015 Ben was viewed as a top prospect in the MNWA. He had a very strong showing early in his career, but struggled to be consistent offensively in 2015. 2016 was a disaster, but Ben bounced back in 2017 to post top 3 MNWA numbers in nearly every category. He was honored as a 3rd team all NWLA hitter in 2017 (along with Buxton teammate Peter Monsrud). A strong 2018 may help him crack the top 10.
Garrett Grage: Garrett has always showed tremendous power, and that was in full display in 2017. Similar to Ben, Garrett had a career year last year finishing in the top 5 in many major categories. In terms of “Hit+Power” tools, Garrett is the best player outside of the top ten. If he can improve his plate discipline in 2018, he could very easily make a major jump.
Chris Neumann: Chris is a very intriguing player, and extremely difficult to evaluate. His lack of playing time is ultimately what has left him off the list. Chris was a dominating presence for the Clowns in the 2017 pennant chase, and if has plenty to build off of in 2018.
T-10: Kevin Knutson:
2/22/2017
Nothing beats the sound of plastic on plastic am I right? Part two of the MNWA’s “Player Rankings” series will shift focus from the defense to the offensive side of the game. Offense, may not dominate the MNWA today, but it is certainly the most entertaining part of the sport to watch.
As a brief reminder the total wiffleball rankings have been broken down into four criteria:
- Pitching (90 Points)
- Offense (75 Points)
- Defense (25 Points)
- Intangibles (10 Point)
- Hitting (25 Points)
- Power (25 Points)
- Plate Discipline (10 Points)
- Baserunning (10 Points)
- Speed (5 Points)
I graded all MNWA players on a variety of stats. Some are obvious (Batting Avg, OBP, Slugging Percentage). Others are commonly excepted in the sabermetric community (OPS, K%, BB%, K:BB ratio, BABIP). Finally, some are stats that I have developed specifically for wiffleball evaluation. Before the 2017 season, I developed a “baserunning efficiency” statistic. The idea is “how efficient are you at running the bases?”, and I gained impactful insights that were applied to the Buxtons this past season (effectively I might add). This stat will be heavily weighted in our “baserunning” score.
Just Missed:
Ben Kapsner: From 2013-2015 Ben was viewed as a top prospect in the MNWA. He had a very strong showing early in his career, but struggled to be consistent offensively in 2015. 2016 was a disaster, but Ben bounced back in 2017 to post top 3 MNWA numbers in nearly every category. He was honored as a 3rd team all NWLA hitter in 2017 (along with Buxton teammate Peter Monsrud). A strong 2018 may help him crack the top 10.
Garrett Grage: Garrett has always showed tremendous power, and that was in full display in 2017. Similar to Ben, Garrett had a career year last year finishing in the top 5 in many major categories. In terms of “Hit+Power” tools, Garrett is the best player outside of the top ten. If he can improve his plate discipline in 2018, he could very easily make a major jump.
Chris Neumann: Chris is a very intriguing player, and extremely difficult to evaluate. His lack of playing time is ultimately what has left him off the list. Chris was a dominating presence for the Clowns in the 2017 pennant chase, and if has plenty to build off of in 2018.
T-10: Kevin Knutson:
- Hit: 17, Power: 13.5, Disc: 7, Baserunning: 9, Speed: 4, Offense: 50.5
- Notable Stats: .293 career avg, .895 career ops, #1 Baserunning efficiency MNWA career
T-10: Matt Newell:
9: Jay Zimmerman:
8: Zack (Dr. Seuss) Eustis
7: John Cronin
6: Zach Bussmann
- Hit: 18.5, Power: 14, Disc: 8.5, Baserunning 7.5, Speed 2, Offense: 50.5
- Notable Stats: .443 career OBP, .896 career OPS, .993 2017 OPS, #4 Career K:BB ratio
9: Jay Zimmerman:
- Hit: 19, Power: 20.5, Disc: 4.5, Baserunning: 3.5, Speed: 3.5, Offense: 51
- Notable Stats: .306 career avg, .988 career OPS .427 career OBP
8: Zack (Dr. Seuss) Eustis
- Hit: 22, Power: 15.5, Disc, 10, Baserunning: 4, Speed: 3, Offense: 54.5
- Notable Stats: .293 career avg, .517 career OBP, #2 career K:BB ratio
7: John Cronin
- Hit: 19, Power: 20, Disc: 4.5, Baserunning: 7.5, Speed: 4.5, Offense: 55.5
- Notable Stats: .306 career avg, .417 2017 avg, #3 Baserunning efficiency 2017
6: Zach Bussmann
- Hit: 18, Power: 21, Disc: 8.5, Baserunning: 6.5, Speed: 3.5, Offense 59
- Notable Stats: .286 career avg, 6.8% career home run rate, .959 career OPS
5: Mat Peisert
- Hit: 23, Power: 17, Disc: 10, Baserunning: 4.5, Speed: 3.5, Offense: 58
- Notable Stats: .379 career avg, .538 career OBP, #1 Career K:BB ratio
4: Sam Essen:
3: Jordan Johnson:
- Hit: 23, Power: 23, Disc: 6, Baserunning: 6, Speed: 4, Offense: 62
- Notable Stats: .400 career avg, 15% HR rate, 1.418 OPS (#1 career)
3: Jordan Johnson:
- Hit: 23, Power: 20.5, Disc: 9, Baserunning 7, Speed: 3.5, Offense: 63
- Notable Stats: .329 career avg, .472 career OBP, 1.024 career OPS
2: Andrew Johnson:
Please watch
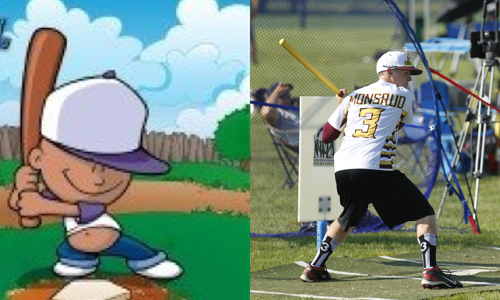
1: Peter Monsrud:
- Hit: 23, Power: 24, Disc: 8, Baserunning: 8, Speed: 5, Offense 68
- Noteable Stats: .311 career avg, 1.094 career OPS, 8.6% career HR rate
Please watch
1: Peter Monsrud:
- Hit: 25, Power: 20.5, Disc: 10, Baserunning 8.5, Speed: 5, Offense: 69
- Noteable Stats: .417 career avg, .553 career OBP, 1.199 career OPS